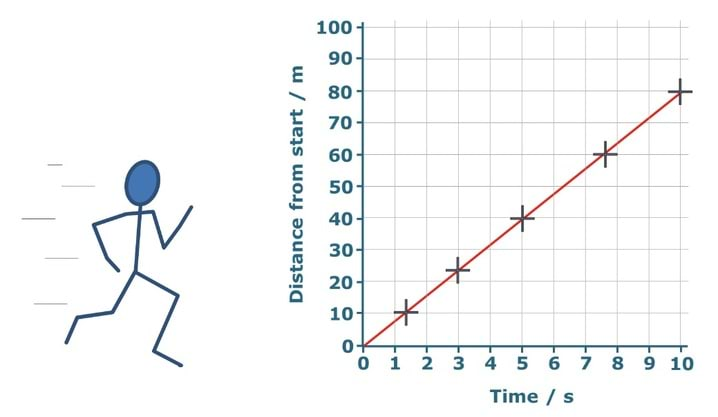
| Learning focus: | Information about the motion of an object can be summarised on a distance-time graph: the plot shows the object’s distance from the start at a given time and the slope (gradient) at that point shows its speed. |
| Observable learning outcome: | Read values of distance or time off the axes of a distance-time graph for a plotted point |
| Question type: | Linking ideas |
| Key words: | Distance, time, graph |
Often text books (and teachers) put great attention on the procedures for plotting graphs and calculating gradients, rather than developing understanding of relationships that a graph shows (Stump, 1999). It can be more constructive to concentrate on the latter, which involves teaching:
- understanding of how to read information directly from a graph, interpreting each axis individually
- how to describe simple relationships between the axes such as those represented by straight lines
- how to interpret a graph, linking what it represents to a real situation (Friel, Curcio and Bright, 2001; Lingefjard and Farahani, 2018)
This task is intended for discussion in pairs or small groups. It is best done as a pencil and paper exercise.
Students should read the statements and follow the instructions on the worksheet. Listening in to the conversations of each group will often give you insights into how your students are thinking. Each member of a group should be able to report back to the class.
Feedback from each group can be used, with careful teacher questioning, to bring out a clear description of how readings are taken from a line graph.
Differentiation
The quality of the discussions can be improved with a careful selection of groups; or by allocating specific roles to students in the each group. For example, you may choose to select a student with strong prior knowledge as the scribe, and forbid them from contributing any of their own answers. They may question the others and only write down what they have been told. This strategy encourages contributions from more members of each group.
NB in any class, small group discussions typically improve over time and a persistence with this strategy is often very successful in the medium to long term.
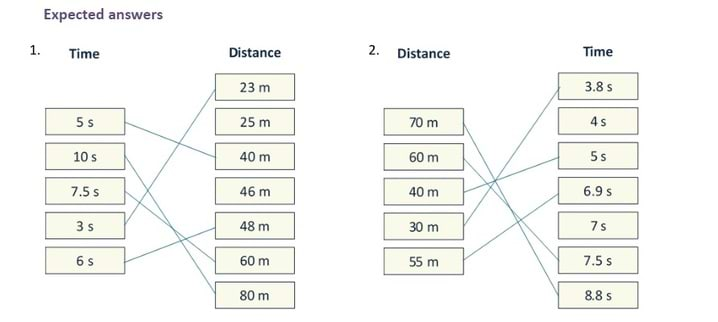
In question 1 distances for 5 and 10 seconds are on the grid lines of both axes. At 7.5 seconds just the distance is on the grid line, and at 3 seconds the reading of distance is not on a grid line. Two of the choices are close to the correct distance. Students choosing 25m at 3s need to account for the plot being closer to 20 than to 30. Students with the correct answer for 6 seconds have made a subtle distinction between 46m and 48m.
In question 2 the time for 40m is on both grid lines and is straight forward. The other readings in this question are more difficult than Q1. With the values of time to choose from, times for 60m and 70m do not have obvious distractors, although some students may choose 7s for 60m if they are not clear that the value 7 marks the grid line and not the column. At 30m it should be clear to students who are being careful that the graph line crosses the grid line before 4s (at 3.8s). The graph line crosses the grid line marking 7s over half way up the 50-60m division, which means at 55m the time is just less than 7s (6.9s).
If students have difficulty in reading values from a line graph, this is often because students have difficulties reading scales. Another common issue is that students who can read the scale do not accurately track across or down from the graph line to the scale. With the latter issue, it can help to give the students practice ruling lines onto graphs to show how they take each reading. Each time they can check to see if their line is parallel to the grid lines.
Students who struggle with reading subdivisions on scales will most likely cover this in detail in mathematics lessons and can practise reading scales during science practical work. It can be more constructive in science lessons to concentrate instead on developing an understanding of the relationships shown by distance-time graphs.
Some practice in plotting graphs can help students to develop an understanding of how pairs of readings are represented on a graph. The following BEST ‘response activity’ could be used in follow-up to this diagnostic question: Response activity: Plot the line
Making Sense of Graphs: Critical Factors Influencing Comprehension and Instructional Implications
Friel, S. N., Curcio, F. R. and Bright, G. W. (2001). Making Sense of Graphs: Critical Factors Influencing Comprehension and Instructional Implications. Journal for Research in Mathematics Education, 32(2), 124-158.

